![[Compaq]](../images/compaq.gif)
![[Go to the documentation home page]](../images/buttons/bn_site_home.gif)
![[How to order documentation]](../images/buttons/bn_order_docs.gif)
![[Help on this site]](../images/buttons/bn_site_help.gif)
![[How to contact us]](../images/buttons/bn_comments.gif)
![[OpenVMS documentation]](../images/ovmsdoc_sec_head.gif)
| Document revision date: 30 March 2001 | |
![[Compaq]](../images/compaq.gif) |
![[Go to the documentation home page]](../images/buttons/bn_site_home.gif)
![[How to order documentation]](../images/buttons/bn_order_docs.gif)
![[Help on this site]](../images/buttons/bn_site_help.gif)
![[How to contact us]](../images/buttons/bn_comments.gif)
|
![[OpenVMS documentation]](../images/ovmsdoc_sec_head.gif)
|
|
| Previous | Contents | Index |
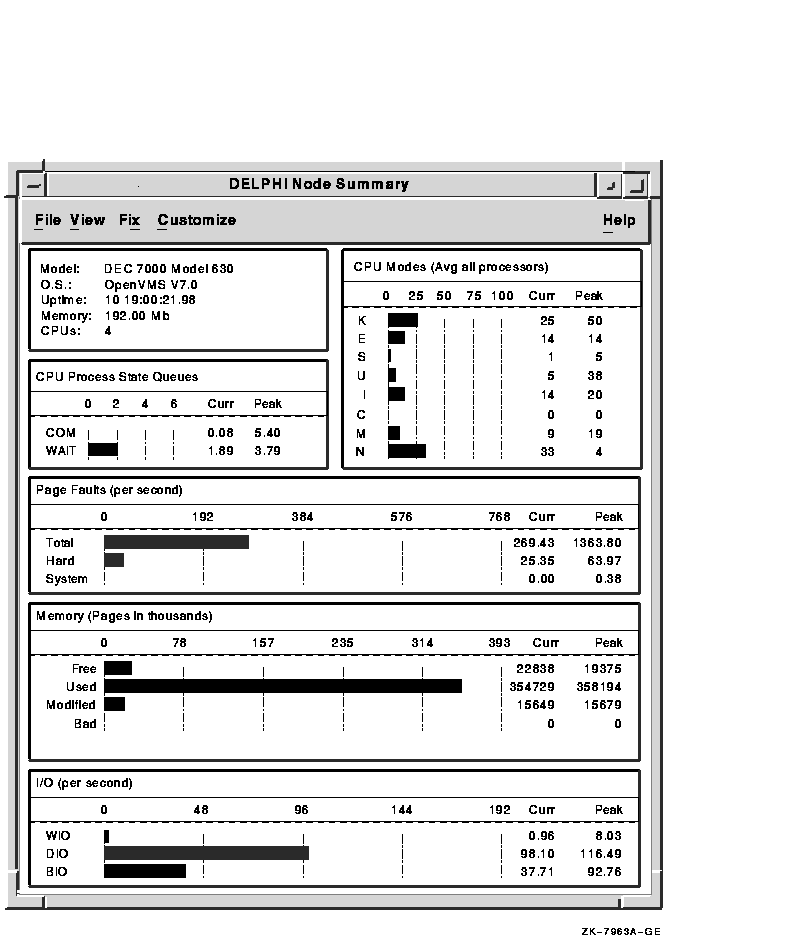
The Node Summary window shown in Figure 3-6 displays a high-level graphic summary of node resource demands on the CPU, memory, and I/O.
Figure 3-6 Node Summary Window
To open a Node Summary window, do one of the following:
Dynamic bar graphs display the current values for each field. Peak values are also displayed from when DECamds begins collecting node summary data. A peak value is typically the highest value received; however, for the Free Memory field it is the lowest value received.
You can open the following windows from the Node Summary Window by double-clicking in the space for each category:
CPU Summary
CPU Modes Summary
Memory Summary
I/O summary
Table 3-6 describes the Node Summary window data fields.
| Field | Displays | ||||
|---|---|---|---|---|---|
| Hardware Model | The system hardware model name. | ||||
| Operating System | The name and version of the operating system. | ||||
| Uptime | The time since last reboot measured in days, hours, minutes, and seconds. | ||||
| Memory | The total amount of physical memory found on the system. | ||||
| CPUs | The number of active CPUs on the node. | ||||
| CPU Process State Queues |
One of the following:
|
||||
| CPU Modes | The CPU usage by mode (kernel, executive, supervisor, user, interrupt, compatibility, multiprocessor synchronization, and null). On symmetric multiprocessing (SMP) nodes, percentages are averaged across all the CPUs and displayed as one value. | ||||
| Page Faults | The rate of system hard and soft page faulting, as well as peak values seen during a DECamds session. System page faults are taken from kernel processes. | ||||
| Memory | The histogram listing memory distribution (Free, Used, Modified, Bad) as absolute values of number of thousands of pages or pagelets. Peak values are also listed, with Free using lowest seen value as peak. | ||||
| I/O | The histogram listing Buffer, Direct, and Page Write I/O rates per second. Also included is the peak value seen. |
DECamds detects the following node events and displays them in the Event Log window. Node is replaced by the name of the node to which the event is related.
HIBIOR, node buffered I/O rate is high
HICOMQ, node many processes waiting for CPU
HIDIOR, node direct I/O rate is high
HIHRDP, node hard page fault rate is high
HIMWTQ, node process waiting in MWAIT
HINTER, node interrupt mode time is high
HIPWIO, node paging write I/O rate is high
HIPWTQ, node many processes waiting in COLPG, PFW, or FPG
HITTLP, node total page fault rate is high
HMPSYN, node MP synchronization mode time is high
HISYSP, node system page fault rate is high
LOMEMY, node free memory is low
NOPROC, node cannot find process names process
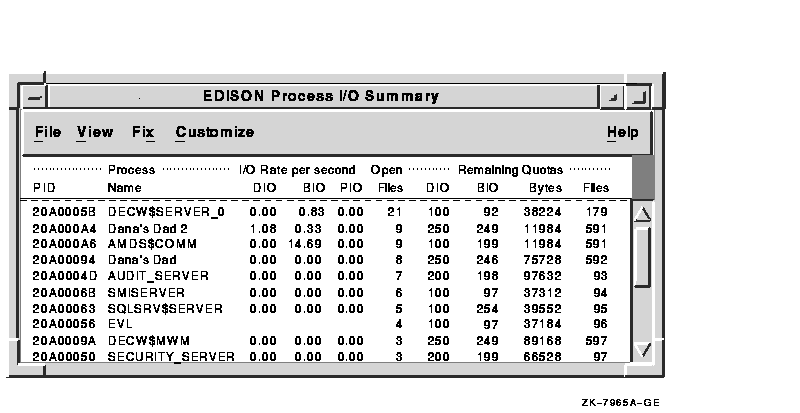
The Process I/O Summary window shown in Figure 3-7 displays summary statistics about process I/O rates and quotas. Use the Process I/O Summary window to display information about I/O issues that might be caused by I/O-intensive programs or I/O bottlenecks.
DECamds does not yet support kernel threads. If you use threaded processes, DECamds displays only the top thread. |
Figure 3-7 Process I/O Summary Window
To open a Process I/O Summary window, do one of the following:
You can open a window about a specific process in the Process I/O Summary window by double-clicking on the process name.
Table 3-7 describes the Process I/O Summary window data fields.
| Field | Displays |
|---|---|
| PID | The process identifier, a 32-bit value that uniquely identifies a process. |
| Process Name | The current process name. |
| Direct I/O Rate (DIO) | The rate at which I/O transfers occur between the system devices and the pages or pagelets that contain the process buffer that the system locks in physical memory. |
| Buffered I/O Rate (BIO) | The rate at which I/O transfers occur between the process buffer and an intermediate buffer from the system buffer pool. |
| Paging I/O Rate (PIO) | The rate of read attempts necessary to satisfy page faults (also known as Page Read I/O or the Hard Fault Rate). |
| Open Files | The number of open files. |
| Direct I/O Limit Remaining (DIO) | The number of remaining direct I/O limit operations available before the process reaches its quota. DIOLM quota is the maximum number of direct I/O operations a process may have outstanding at one time. |
| Buffered I/O Limit Remaining (BIO) | The number of remaining buffered I/O operations available before the process reaches its quota. BIOLM quota is the maximum number of buffered I/O operations a process may have outstanding at one time. |
| Byte Limit Remaining (Bytes) | The number of buffered I/O bytes available before the process reaches its quota. BYTLM is the maximum number of bytes of nonpaged system dynamic memory that a process can claim at one time. |
| Open File Limit Remaining (Files) | The number of additional files the process can open before reaching its quota. FILLM quota is the maximum number of files that can be opened simultaneously by the process, including active network logical links. |
DECamds detects the following process I/O-related events and displays them in the Event Log window. Node is replaced by the name of the node to which the event is related. Process is replaced by the name of the process to which the event is related.
LOBIOQ, node process has used most of its BIOLM process quota
LOBYTQ, node process has used most of its BYTLM job quota
LODIOQ, node process has used most of its DIOLM process quota
LOFILQ, node process has used most of its FILLM job quota
PRBIOR, node process buffered I/O rate is high
PRDIOR, node process direct I/O rate is high
PRPIOR, node process paging I/O rate is high
3.7 CPU Modes Summary Window
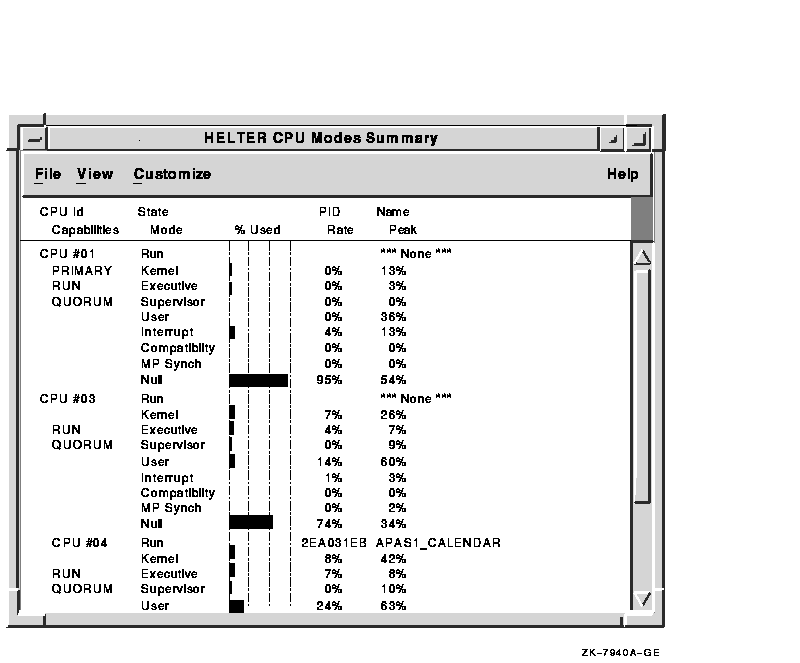
The CPU Modes Summary window shown in Figure 3-8 displays more
detailed summary statistics about CPU mode usage than the Node Summary
window. Use the CPU Modes Summary window to diagnose issues that may be
caused by CPU-intensive users or CPU bottlenecks.
Figure 3-8 CPU Modes Summary Window
To open a CPU Modes Summary window, do one of the following:
You can open a window about a specific process in the CPU Modes Summary window by double-clicking on the process name.
Table 3-8 describes the CPU Modes Summary window data fields.
| Field | Displays |
|---|---|
| CPU ID | A decimal value representing the identity of a process in a multiprocessing system. On a uniprocessor, this value will always be CPU #00. |
| Capabilities | One of the the following CPU capabilities: Primary, Quorum, Run, or Vector. |
| State | One of the following CPU states: Boot, Booted, Init, Rejected, Reserved, Run, Stopped, Stopping, or Timeout. |
| Mode | One of the following values for CPU modes supported for the architecture: Compatibility, Executive, Interrupt, Kernel, MP Synch, Null, Supervisor, or User. Note: Compatibility mode does not exist on OpenVMS Alpha systems. |
| % Used | A bar graph, by CPU, representing the percentage of the CPU utilization for each mode. |
| PID | The process identifier value of the process that is using the CPU. If the PID is unknown to the console application, the internal PID (IPID) will be listed. |
| Name | The process name of the process found in the CPU. If no process is found in the CPU, this will be listed as *** None ***. |
| Rate | A numerical percentage of CPU time for each mode. |
| Peak | The peak CPU usage determined for each mode. |
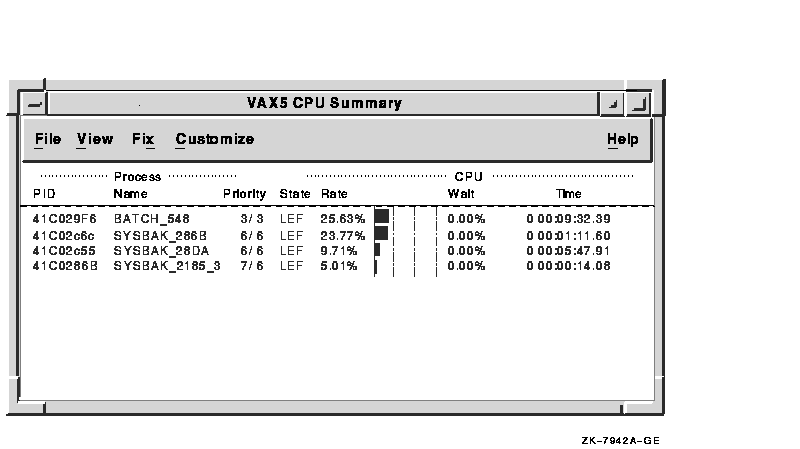
The CPU Summary window shown in Figure 3-9 displays summary statistics about process CPU usage issues that might be caused by CPU-intensive users or CPU bottlenecks.
Figure 3-9 CPU Summary Window
To open a CPU Summary window, do one of the following:
You can open a window about a specific process in the CPU Summary window by double-clicking on the process name.
Table 3-9 describes the CPU Summary window data fields.
| Field | Displays |
|---|---|
| PID | The process identifier, a 32-bit value that uniquely identifies a process. |
| Name | The process name. |
| Priority | Computable (xx) and base (yy) process priority in the format xx/yy. |
| State | One of the values listed under the Single Process Summary description in Table 3-11. |
| Rate | The percent of CPU time used by this process. This is the ratio of CPU time to elapsed time. The CPU rate is also displayed in the bar graph. |
| Wait | The percent of time the process is in the COM or COMO state. |
| Time | The amount of actual CPU time charged to the process. |
DECamds detects the following CPU-related events and displays them in the Event Log window. Node is replaced by the name of the node to which the event is related. Process is replaced by the name of the process to which the event is related.
PRCCOM, node process waiting in COM or COMO
PRCCVR, node process has high CPU rate
PRCMWT, node process waiting in MWAIT
PRCPWT, node process waiting in COLPG, PFW, or FPG
3.9 Memory Summary Window
The Memory Summary window shown in Figure 3-10 displays memory usage
data for processes on a node so that you can identify processes that
use large amounts of memory or have high page fault rates.
Figure 3-10 Memory Summary Window
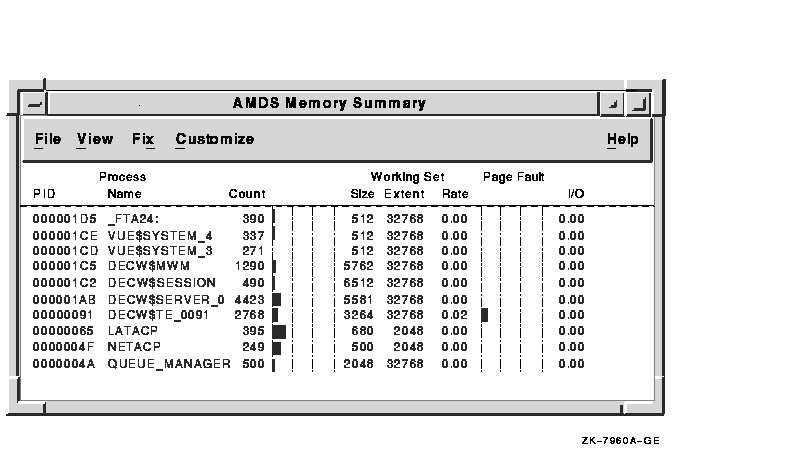
To open a Memory Summary window, do one of the following:
You can open a window about a specific process in the Memory Summary window by double-clicking on the process name.
Table 3-10 describes the Memory Summary window data fields.
| Field | Displays |
|---|---|
| PID | The process identifier, a 32-bit value that uniquely identifies a process. |
| Process Name | The process name. |
| Working Set Count 1 | The number of physical pages or pagelets of memory that the process is using. The bar graph represents the percentage of working set count used to the working set extent. |
| Working Set Size 1 | The number of pages or pagelets of memory the process is allowed to use. This value is periodically adjusted by the operating system based on analysis of page faults relative to CPU time used. When the value increases in large units, this indicates a process is receiving a lot of page faults and its memory allocation is increasing. |
| Working Set Extent 1 | The number of pages or pagelets of memory in the process's WSEXTENT quota as defined in the user authorization file (UAF). The number of pages or pagelets will not exceed the value of the system parameter WSMAX. |
| Page Fault Rate | The number of page faults per second for the process. The bar graph represents a relative number of page faults per second. |
| Page Fault I/O | The rate of read attempts necessary to satisfy page faults (also known as Page Read I/O or the Hard Fault Rate). |
DECamds detects the following memory-related events and displays them in the Event Log window. Node is replaced by the name of the node to which the event is related. Process is replaced by the name of the process to which the event is related.
LOWEXT, node process working set extent is too small
LOWSQU, node process working set quota is too small
PRPGFL, node process high page fault rate
PRPIOR, node process paging I/O rate is high
3.10 Single Process Summary Window
The Single Process Summary window shown in Figure 3-11 displays
summary data about a process, including Execution Rates, Process Quotas
in Use, Wait States, and Job Quotas in Use.
Figure 3-11 Single Process Summary Window
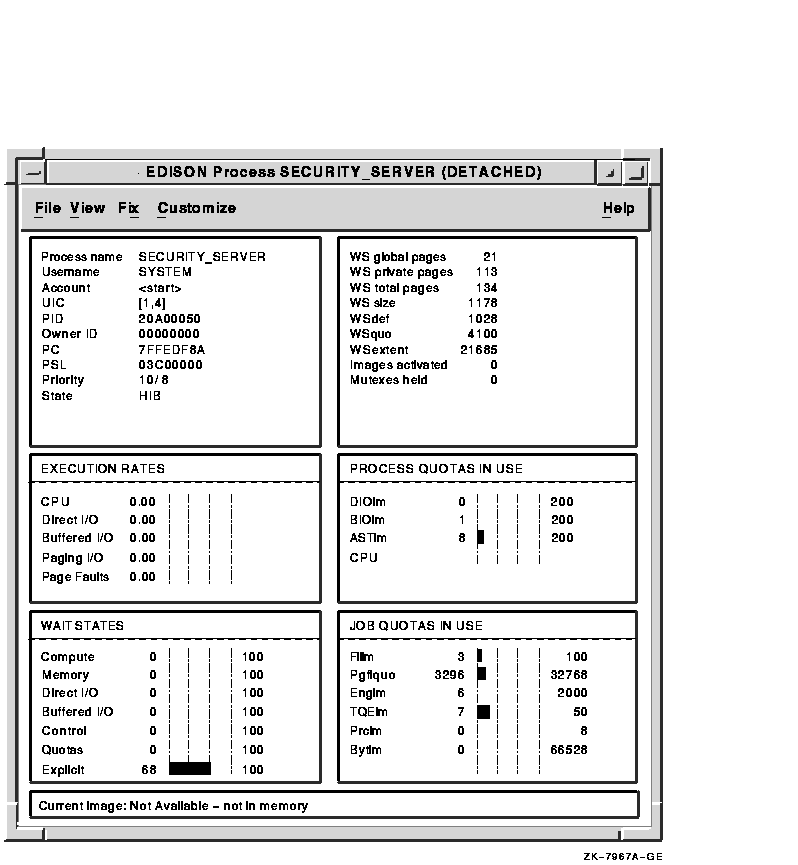
To open a Single Process Summary window, do one of the following:
Table 3-11 describes the Single Process Summary window data fields.
| Field | Displays | ||||||||||||||||||||||||||||||||||||||||||||||||||||||||||||
|---|---|---|---|---|---|---|---|---|---|---|---|---|---|---|---|---|---|---|---|---|---|---|---|---|---|---|---|---|---|---|---|---|---|---|---|---|---|---|---|---|---|---|---|---|---|---|---|---|---|---|---|---|---|---|---|---|---|---|---|---|---|
| Process name | The name of the process. | ||||||||||||||||||||||||||||||||||||||||||||||||||||||||||||
| Username | The user name of the user owning the process. | ||||||||||||||||||||||||||||||||||||||||||||||||||||||||||||
| Account | The string assigned to the user by the system manager. | ||||||||||||||||||||||||||||||||||||||||||||||||||||||||||||
| UIC | The user identification code (UIC), a pair of numbers or character strings designating the group and user. | ||||||||||||||||||||||||||||||||||||||||||||||||||||||||||||
| PID | The process identifier, a 32-bit value that uniquely identifies a process. | ||||||||||||||||||||||||||||||||||||||||||||||||||||||||||||
| Owner ID | The PID of the process that created the process displayed in the window. If 0, then the process is a parent process. | ||||||||||||||||||||||||||||||||||||||||||||||||||||||||||||
| PC | The program counter. On OpenVMS VAX systems, this is the address of the next instruction the CPU will execute. On OpenVMS Alpha systems, this value is displayed as 0, because the data is not readily available to the Data Provider node. | ||||||||||||||||||||||||||||||||||||||||||||||||||||||||||||
| PSL | The processor status longword (PSL). On OpenVMS VAX systems, this indicates the current processor mode (user, kernel, and so on) and its interrupt level. On OpenVMS Alpha systems, this value is displayed as 0, because the data is not readily available to the Data Provider node. | ||||||||||||||||||||||||||||||||||||||||||||||||||||||||||||
| Priority | The computable and base priority of the process. Priority is an integer between 0 and 31. Processes with higher priority get more CPU time. | ||||||||||||||||||||||||||||||||||||||||||||||||||||||||||||
| State |
One of the following process states:
|
||||||||||||||||||||||||||||||||||||||||||||||||||||||||||||
| WS global pages | The shared data or code between processes, listed in pages or pagelets. | ||||||||||||||||||||||||||||||||||||||||||||||||||||||||||||
| WS private pages | The amount of accessible memory, listed in pages or pagelets. | ||||||||||||||||||||||||||||||||||||||||||||||||||||||||||||
| WS total pages | The sum of global and private pages or pagelets. | ||||||||||||||||||||||||||||||||||||||||||||||||||||||||||||
| WS size | The working set size, number of pages or pagelets of memory the process is allowed to use. This value is periodically adjusted by the operating system based on analysis of page faults relative to CPU time used. When it increases in large units, this indicates a process is taking a lot of page faults and its memory allocation is increasing. | ||||||||||||||||||||||||||||||||||||||||||||||||||||||||||||
| WSdef | The working set default, the initial limit to the number of physical pages or pagelets of memory the process can use. This parameter is listed in the user authorization file (UAF); discrepancies between the UAF value and the displayed value are due to page/longword boundary rounding or other adjustments made by the operating system. | ||||||||||||||||||||||||||||||||||||||||||||||||||||||||||||
| WSquo | The working set quota, the maximum amount of physical pages or pagelets of memory the process can lock into its working set. This parameter is listed in the UAF; discrepancies between the UAF value and the displayed value are due to page/longword boundary rounding or other adjustments made by the operating system. | ||||||||||||||||||||||||||||||||||||||||||||||||||||||||||||
| WSextent | The working set extent, the maximum number of physical pages or pagelets of memory the system will allocate for the process. The system provides memory to a process beyond its quota only when it has an excess of free pages and can be recalled if necessary. This parameter is listed in the UAF; any discrepancies between the UAF value and the displayed value are due to page/longword boundary rounding or other adjustments made by the operating system. | ||||||||||||||||||||||||||||||||||||||||||||||||||||||||||||
| Images activated | The number of times an image is activated. | ||||||||||||||||||||||||||||||||||||||||||||||||||||||||||||
| Mutexes held | The number of mutual exclusions (mutexes) held. Persistent values other than zero (0) require analysis. A mutex is similar to a lock but is restricted to one CPU. When a process holds a mutex, its priority is temporarily incremented to 16. | ||||||||||||||||||||||||||||||||||||||||||||||||||||||||||||
| Execution Rates | |||||||||||||||||||||||||||||||||||||||||||||||||||||||||||||
| CPU | The percent of CPU time used by this process. This is the ratio of CPU time to elapsed time. CPU rate is also displayed in the bar graph. | ||||||||||||||||||||||||||||||||||||||||||||||||||||||||||||
| Direct I/O | The rate at which I/O transfers take place from the pages or pagelets containing the process buffer that the system locks in physical memory to the system devices. | ||||||||||||||||||||||||||||||||||||||||||||||||||||||||||||
| Buffered I/O | The rate at which I/O transfers take place for the process buffer from an intermediate buffer from the system buffer pool. | ||||||||||||||||||||||||||||||||||||||||||||||||||||||||||||
| Paging I/O | The rate of read attempts necessary to satisfy page faults. This is also known as Page Read I/O or the Hard Fault Rate. | ||||||||||||||||||||||||||||||||||||||||||||||||||||||||||||
| Page Faults | The page faults per second for the process. The bar graph visually represents page faults per second. | ||||||||||||||||||||||||||||||||||||||||||||||||||||||||||||
| Process Quotas in Use1 | |||||||||||||||||||||||||||||||||||||||||||||||||||||||||||||
| DIOLM | Direct I/O Limit. A bar graph representing current count of DIOs used with respect to the limit that can be attained. | ||||||||||||||||||||||||||||||||||||||||||||||||||||||||||||
| BIOLM | Buffered I/O Limit. A bar graph representing current count of BIOs used with respect to the limit that can be attained. | ||||||||||||||||||||||||||||||||||||||||||||||||||||||||||||
| ASTLM | Asynchronous System Traps Limit. A bar graph representing current count of ASTs used with respect to the limit that can be attained. | ||||||||||||||||||||||||||||||||||||||||||||||||||||||||||||
| CPU | CPU Time Limit. A bar graph representing current count of CPU time used with respect to the limit that can be attained. If the limit is 0, then this value is not used. | ||||||||||||||||||||||||||||||||||||||||||||||||||||||||||||
| Wait States2 | |||||||||||||||||||||||||||||||||||||||||||||||||||||||||||||
| Compute | A relative value indicating that the process is waiting for CPU time. The included states are COM, COMO, RWCAP. | ||||||||||||||||||||||||||||||||||||||||||||||||||||||||||||
| Memory | A relative value indicating that the process is waiting for a page fault that requires data to be read from disk; common during image activation. The included states are PFW, COLPG, FPG, RWPAG, RWNPG, RWMPE, RWMPB. | ||||||||||||||||||||||||||||||||||||||||||||||||||||||||||||
| Direct I/O | A relative value indicating that the process is waiting for data to be read from or written to a disk. The included state is DIO. | ||||||||||||||||||||||||||||||||||||||||||||||||||||||||||||
| Buffered I/O | A relative value indicating that the process is waiting for data to be read from or written to a slower device such as a terminal, line printer, or mailbox. The included state is BIO. | ||||||||||||||||||||||||||||||||||||||||||||||||||||||||||||
| Control | A relative value indicating that the process is waiting for another process to release control of some resource. The included states are CEF, MWAIT, LEF, LEFO, RWAST, RWMBX, RWSCS, RWCLU, RWCSV, RWUNK, and LEF waiting for a ENQ. | ||||||||||||||||||||||||||||||||||||||||||||||||||||||||||||
| Quotas | A relative value indicating that the process is waiting because the process has exceeded some quota. The included states are QUOTA and RWAST_QUOTA. | ||||||||||||||||||||||||||||||||||||||||||||||||||||||||||||
| Explicit | A relative value indicating that the process is waiting because the process asked to wait, such as a hibernate system service. The included states are HIB, HIBO, SUSP, SUSPO, and LEF waiting for a TQE. | ||||||||||||||||||||||||||||||||||||||||||||||||||||||||||||
| Job Quotas in Use | |||||||||||||||||||||||||||||||||||||||||||||||||||||||||||||
| FILLM | File Limit. A bar graph representing current number of open files with respect to the limit that can be attained. | ||||||||||||||||||||||||||||||||||||||||||||||||||||||||||||
| PGFLQUO | Page File Quota. A bar graph representing current number of disk blocks in page file that the process can use with respect to the limit that can be attained. | ||||||||||||||||||||||||||||||||||||||||||||||||||||||||||||
| ENQLM | Enqueue Limit. A bar graph representing current count of resources (lock blocks) queued with respect to the limit that can be attained. | ||||||||||||||||||||||||||||||||||||||||||||||||||||||||||||
| TQELM | Timer Queue Entry Limit. A bar graph representing current count of timer requests with respect to the limit that can be attained. | ||||||||||||||||||||||||||||||||||||||||||||||||||||||||||||
| PRCLM | Process Limit. A bar graph representing current count of subprocesses created with respect to the limit that can be attained. | ||||||||||||||||||||||||||||||||||||||||||||||||||||||||||||
| BYTLM | Buffered I/O Byte Limit. A bar graph representing current count of bytes used for buffered I/O transfers with respect to the limit that can be attained. | ||||||||||||||||||||||||||||||||||||||||||||||||||||||||||||
| Image Name | The name of the currently executing image, if available. If this field does not appear, then the data is not resident in memory. | ||||||||||||||||||||||||||||||||||||||||||||||||||||||||||||
| Previous | Next | Contents | Index |
![[Go to the documentation home page]](../images/buttons/bn_site_home.gif)
![[How to order documentation]](../images/buttons/bn_order_docs.gif)
![[Help on this site]](../images/buttons/bn_site_help.gif)
![[How to contact us]](../images/buttons/bn_comments.gif)
|
| privacy and legal statement | ||
| 5929PRO_003.HTML | ||