Figure 5-4 OpenVMS Data Collection Customization

On the Data Collection Customization page, for example, the Event interval for Disk Status data collection is every 15 seconds.
| Previous | Contents | Index |
The display of information about LAN VC channel selection depends on the version of OpenVMS and whether managed objects have been enabled. (For more information about managed objects, see the introduction to this chapter.)
Figure 4-22 is an example of a Nonmanaged Object LAN VC Channel Selection Data page.
Figure 4-22 LAN VC Channel Selection Data (Nonmanaged Objects)

Table 4-22 describes the data displayed in Figure 4-22.
| Data | Description |
|---|---|
| Buffer Size | Maximum data buffer size for this virtual circuit. |
| Channel Count | Number of channels available for use by this virtual circuit. |
| Channel Selections | Number of channel selections performed. |
| Protocol | NISCA protocol version. |
| Local Device | Name of the local LAN device that the channel uses to send and receive packets. |
| Local LAN Address | Address of the local LAN device that performs sends and receives. |
| Remote Device | Name of the remote LAN device that the channel uses to send and receive packets. |
| Remote LAN Address | Address of the remote LAN device performing the sends and receives. |
Systems running Availability Manager with managed objects enabled collect and display the following information about LAN VC Channel Selection Data. (For more information about managed objects, see the introduction to this chapter.)
An additional requirement for displaying some of the data on this data page is that managed objects be enabled on your system. For more information, see the HP Availability Manager Installation Instructions. |
Figure 4-23 is an example of a LAN VC Channel Selection Data page with managed objects enabled.
Figure 4-23 LAN VC Channel Selection Data (Managed Objects Enabled)

Table 4-23 describes the data displayed in Figure 4-23.
| Data | Description |
|---|---|
| ECS Priority | Current minimum priority a tight channel must have in order to be an ECS member. |
| Buffer Size | Maximum data buffer size for this virtual circuit. A channel must have this buffer size in order to be an ECS member. |
| Hops | Current minimum management hops a channel must have in order to be included in the ECS. |
| Channel Count | Number of channels currently available for use by this virtual circuit. |
| Channel Selections | Number of channel selections performed. |
| Protocol | Remote node's NISCA protocol version. |
| Speed Demote Threshold | Current threshold for reclassifying a FAST channel to SLOW. |
| Speed Promote Threshold | Current threshold for reclassifying a SLOW channel to FAST. |
| Min RTT | Current minimum average delay of any current ECS members. |
| Min RTT Threshold | Current threshold for reclassifying a channel as FASTER than the current set of ECS channels. |
| Mgmt Demote Threshold | A management-specified lower limit on the maximum delay (in microseconds) an ECS member channel can have. Whenever at least one tight peer channel has a delay of less than the management-supplied value, all tight peer channels with delays less than the management-supplied value are automatically included in the ECS. When all tight peer channels have delays equal to or greater than the management setting, the ECS membership delay thresholds are automatically calculated and used. |
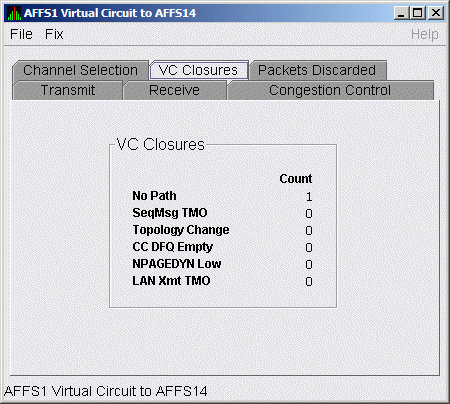
LAN VC closures data is information about the number of times a virtual circuit has closed for a particular reason. Figure 4-24 is an example of a LAN VC Closures Data page.
An entry that is dimmed indicates that the current version of OpenVMS does not support that item.
Figure 4-24 LAN VC Closures Data

Table 4-24 describes the data displayed in Figure 4-24.
| Data | Description |
|---|---|
| No Path | Number of times the VC was closed because no usable LAN path was available. |
| SeqMsg TMO | Number of times the VC was closed because a sequenced packet's retransmit timeout count limit was exceeded. |
| Topology Change | Number of times the VC was closed because PEDRIVER performed a failover from a LAN path (or paths) with a large packet size to a LAN path with a smaller packet size. |
| CC DFQ Empty | Number of times the VC was closed because the channel control data-free queue (DFQ) was empty. |
| NPAGEDYN Low | Number of times the VC was closed because of a nonpaged pool allocation failure in the local node. |
| LAN Xmt TMO | Number of times the VC was closed because the LAN device used to send the packet did not report transmit completion before the packet's transmit timeout limit was exceeded. |
LAN VC packets discarded data is information about the number of times packets were discarded for a particular reason. Figure 4-25 is an example of a LAN VC Packets Discarded Data page.
Figure 4-25 LAN VC Packets Discarded Data

Table 4-25 describes the data displayed in Figure 4-25.
| Data | Description |
|---|---|
| Bad Checksum | Number of times there was a checksum failure on a received packet. |
| No Xmt Chan | Number of times no transmit channel was available. |
| Rcv Short Msg | Number of times an undersized transport packet was received. |
| Ill Seq Msg | Number of times an out-of-range sequence numbered packet was received. |
| TR DFQ Empty | Number of times the transmit data-free queue (DFQ) was empty. |
| TR MFQ Empty | Number of times the TR layer message-free queue (MFQ) was empty. |
| CC MFQ Empty | Number of times the channel control MFQ was empty. |
| Rcv Window Miss | Number of packets that could not be placed in the virtual circuit's receive cache because the cache was full. |
Before you start this chapter, be sure to read the explanations of data collection, events, thresholds, and occurrences in Chapter 1. |
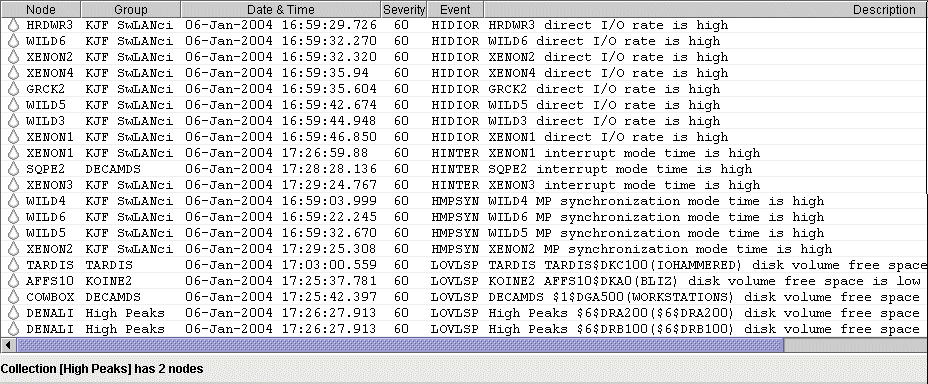
The Availability Manager indicates resource availability problems in the Event pane (Figure 5-1) of the main System Overview window (Figure 1-1).
Figure 5-1 OpenVMS Event Pane

The Event pane helps you identify system problems. In many cases, you can apply fixes to correct these problems as well, as explained in Chapter 6.
The Availability Manager displays a warning message in the Event pane whenever
it detects a resource availability problem. If logging is enabled (the
default), the Availability Manager also logs each event in the Events Log
file, which you can display or print. (For the location of this file
and a cautionary note about it, see Section 5.2.)
5.1 Event Information Displayed in the Event Pane
The Availability Manager can display events for all nodes that are currently in communication with the Data Analyzer. When an event of a certain severity occurs, the Availability Manager adds the event to a list in the Event pane.
The length of time an event is displayed depends on the severity of the event. Less severe events are displayed for a short period of time (30 seconds); more severe events are displayed until you explicitly remove the event from the Event pane (explained in Event Pane Menu Options).
Table 5-1 provides additional information about the data items that are displayed in the Event pane.
| Data Item | Description |
|---|---|
| Node | Name of the node causing the event |
| Group | Group of the node causing the event |
| Date | Date the event occurred |
| Time | Time that an event was detected |
| Sev | Severity: a value from 0 to 100. (You can customize this value to indicate the importance of the event, with 100 as the most important.) |
| Event | Alphanumeric identifier of the type of event |
| Description | Short description of the resource availability problem |
Appendix B contains tables of events that are displayed in the Event pane. In addition, these tables contain an explanation of each event and the recommended remedial action.
When you right-click a node name or data item in the Event pane, the Availability Manager displays a shortcut menu with the following options:
| Menu Option | Description |
|---|---|
| Display | Displays the Node Summary page associated with that event. |
| Remove | Removes an event from the display. |
| Freeze/Unfreeze | Freezes a value in the display until you "unfreeze" it; a snowflake icon is displayed to the left of an event that is frozen. |
| Customize | Allows you to customize events. |
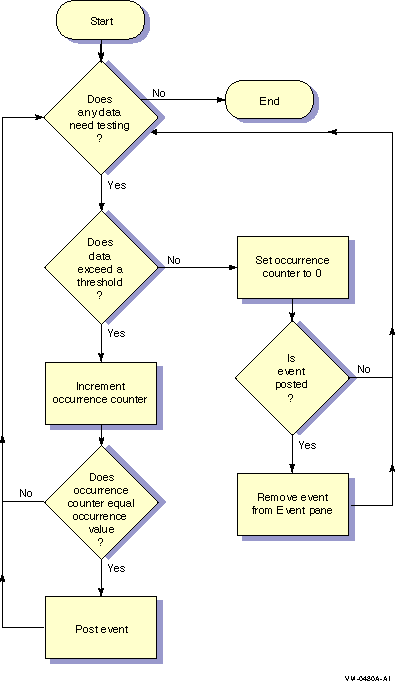
During data collection, any time data meets or exceeds the threshold for an event, an occurrence counter is incremented. When the incremented value matches the value in the Occurrence box on the Event Customization page (Figure 5-2), the event is posted in the Event pane of the System Overview window (Figure 1-1).
Figure 5-2 Sample Event Customization

The sample Event Customization page indicates a threshold of 15 errors and an occurrence value of 2. This means that if the DSKERR event exceeds its threshold of 15 for two consecutive data collections, the DSKERR event is posted in the Event pane.
Note that some events are triggered when data is lower than the threshold; other events are triggered when data is higher than the threshold.
If, at any time during data collection, the data does not meet or exceed the threshold, the occurrence counter is set to zero, and the event is removed from the Event pane. Figure 5-3 depicts this sequence.
Figure 5-3 Testing for Events

When an event is posted, the following actions occur:
Figure 5-4 OpenVMS Data Collection Customization

Figure 5-5 OpenVMS Group/Node Pane

When an event is posted, the following actions also occur:
AMDS$AM_LOG:ANALYZEREVENTS.LOG
|
AnalyzerEvents.log
|
VAXJET 01-22-2004 11:24:50.67 0  CFGDON  VAXJET configuration done
DBGAVC 01-22-2004 11:25:12.41 0  CFGDON  DBGAVC configuration done
AFFS5  01-22-2004 11:25:13.23 0  CFGDON  AFFS5 configuration done
DBGAVC 01-22-2004 11:25:18.31 80 LCKCNT  DBGAVC possible contention for resource REG$MASTER_LOCK
VAXJET 01-22-2004 11:25:27.47 40 LOBIOQ  VAXJET LES$ACP_V30 has used most of
                                         its BIOLM process quota
PEROIT 01-22-2004 11:25:27.16 0  CFGDON  PEROIT configuration done
KOINE  01-22-2004 11:25:33.05 99 NOSWFL  KOINE has no swap file
MAWK   01-22-2004 11:26:20.15 99 FXTIMO  MAWK Fix timeout for FID to Filename Fix
MAWK   01-22-2004 11:26:24.48 60 HIDIOR  MAWK direct I/O rate is high
REDSQL 01-22-2004 11:26:30.61 10 PRPGFL  REDSQL _FTA2: high page fault rate
REDSQL 01-22-2004 11:26:31.18 60 PRPIOR  REDSQL _FTA7: paging I/O rate is high
MAWK   01-22-2004 11:26:24.48 60 HIDIOR  MAWK direct I/O rate is high
AFFS52 01-22-2004 11:25:33.64 60 DSKMNV  AFFS52 $4$DUA320(OMTV4) disk mount verify in progress
VAXJET 01-22-2004 11:38:46.23 90 DPGERR  VAXJET error executing driver program, ...
REDSQL 01-22-2004 11:39:18.73 60 PRCPWT  REDSQL _FTA2: waiting in PWAIT
REDSQL 01-22-2004 11:44:37.19 75 PRCCUR  REDSQL _FTA7: has a high CPU rate
|
If you collect data on many nodes, running the Availability Manager for a long period of time can result in a large events log. For example, in a run that monitors more than 50 nodes with most of the background data collection enabled, the events log can grow by up to 30 MB per day. At this rate, systems with small disks might fill up the disk on which the events log resides. Closing the Availability Manager application will enable you to access the events log for tasks such as archiving. Starting the Availability Manager starts a new events log. |
For more detailed information about a specific event, double-click any event data item in the Event pane. The Availability Manager first displays a data page that most closely corresponds to the cause of the event. You can choose other tabs for additional detailed information.
For a description of data pages and the information they contain, see Chapter 3.
| Previous | Next | Contents | Index |