 |
HP OpenVMS systems documentation |
| Previous | Contents | Index |
A program display can receive the output of the program being debugged. The predefined PROMPT display belongs to the program display kind, and is the only display permitted of that kind. You cannot create a new display of the program display kind.
To avoid possible confusion, the PROMPT display has several
restrictions (see Section 7.4.3).
7.3 Display Attributes
In screen mode, the output from commands you enter interactively is directed to various displays according to the type of output and the display attributes assigned to these displays. For example, debugger diagnostic messages go to the display that has the error attribute (the current error display). By assigning one or more attributes to a display, you can mix or isolate different kinds of information.
The attributes have the following names:
error
input
instruction
output
program
prompt
scroll
source
When a display is assigned an attribute, the name of that attribute appears in lowercase letters on the top border of its window to the right of the display name. Note that the scroll attribute does not affect debugger output but is used to control the default display for the SCROLL, MOVE, and EXPAND commands.
By default, attributes are assigned to the predefined displays as follows:
To assign an attribute to a display, use the SELECT command with the qualifier of the same name as the attribute. In the following example, the DISPLAY command creates the output display ZIP. The SELECT/OUTPUT command then selects ZIP as the current output display---the display that has the output attribute. After this command is executed, the word "output" disappears from the top border of the predefined output display OUT and appears instead on display ZIP, and all the debugger output formerly directed to OUT is now directed to ZIP.
DBG> DISPLAY ZIP OUTPUT DBG> SELECT/OUTPUT ZIP |
You can assign specific attributes only to certain display kinds. The following list identifies each of the SELECT command qualifiers, its effect, and the display kinds to which you can assign that attribute:
Subject to the restrictions listed, a display can have several attributes. In the preceding example, ZIP was selected as the current output display. In the next example, ZIP is further selected as the current input, error, and scrolling display. After these commands are executed, debugger input, output, and diagnostics are logged in ZIP in the proper sequence as they occur, and ZIP is the current scrolling display.
DBG> SELECT/INPUT/ERROR/SCROLL ZIP |
To identify the displays currently selected for each of the display attributes, use the SHOW SELECT command.
If you use the SELECT command with a particular qualifier but without
specifying a display name, the effect is typically to deassign that
attribute (to unselect the display that had the attribute). The exact
effect depends on the attribute, as described in the preceding table.
7.4 Predefined Displays
The debugger provides the following predefined displays that you can use to capture and display different kinds of data:
SRC, the predefined source display
OUT, the predefined output display
PROMPT, the predefined prompt display
INST, the predefined instruction display
REG, the predefined register display
FREG, the predefined floating-point register display (Alpha only)
IREG, the predefined integer register display
When you enter screen mode, the debugger puts SRC in the top half of the screen, PROMPT in the bottom sixth, and OUT between SRC and PROMPT, as shown in Figure 7-1. Displays INST, REG, FREG (Alpha only), and IREG are initially removed from the screen by default.
To re-create this default configuration, press BLUE MINUS on the keypad (PF4 followed by the MINUS (--) key).
The basic features of the predefined displays are described in the next sections. As explained in other parts of this chapter, you can change certain characteristics of these displays, such as the buffer size or display attributes. You can also create additional displays similar to the predefined displays.
To display summary information about the characteristics of any display, use the SHOW DISPLAY command.
Table 7-2 summarizes key information about the predefined displays.
| Display Name | Display Kind | Valid Display Attributes | Visible on Startup |
|---|---|---|---|
| SRC | Source |
Scroll
Source (By Default) |
X |
| OUT | Output |
Error
Input Output (By Default) Scroll |
X |
| PROMPT | Output |
Error (By Default)
Output Program (By Default) Prompt (By Default) Scroll 1 |
X |
| INST | Instruction |
Instruction
Scroll |
|
| REG | Register | Scroll | |
| FREG (Alpha only) | Register | Scroll | |
| IREG | Register | Scroll |
See Chapter 6 for information about how to make source code available for display during a debugging session. |
The predefined display SRC (see Figure 7-1) is an automatically updated source display.
You can use SRC to display source code in two basic ways:
The name of the module whose source code is displayed is shown at the right of the display name, SRC. The numbers displayed at the left of the source code are the compiler-generated line numbers, as they might appear in a compiler-generated listing file.
As you execute the program under debugger control, SRC is automatically updated whenever execution is paused. The arrow in the leftmost column indicates the source line to be executed next. Specifically, execution is paused at the first instruction associated with that source line. Thus, the line indicated by the arrow corresponds to the current program counter (PC) value. The PC is a register that contains the memory address of the next instruction to be executed.
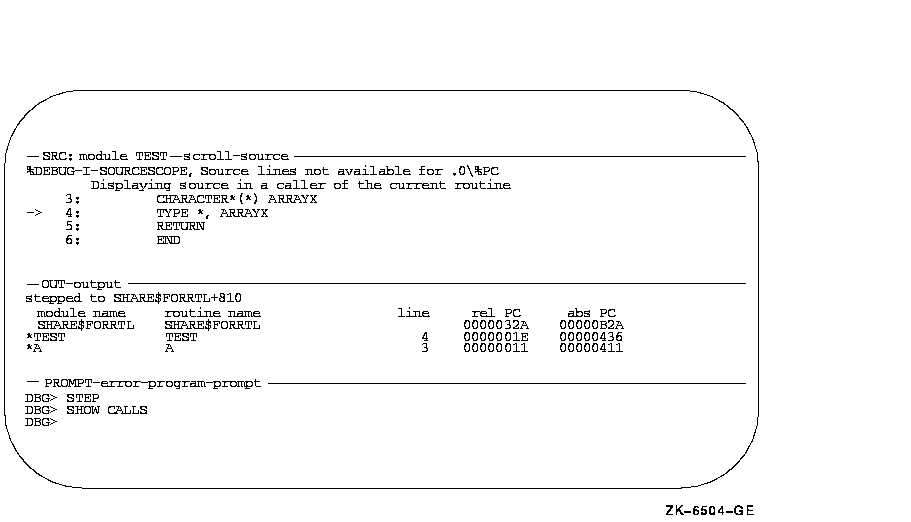
If the debugger cannot locate source code for the routine in which execution is paused (because, for example, the routine is a run-time library routine), it tries to display source code in the next routine down on the call stack for which source code is available. When displaying source code for such a routine, the debugger issues the following message:
%DEBUG-I-SOURCESCOPE, Source lines not available for .0\%PC.
        Displaying source in a caller of the current routine.
|
Figure 7-2 shows this feature. The source display shows that a call to routine TYPE is currently active. TYPE corresponds to a Fortran run-time library procedure. No source code is available for that routine, so the debugger displays the source code of the calling routine. The output of a SHOW CALLS command, shown in the output display, identifies the routine where execution is paused and the call sequence leading to that routine.
In such cases, the arrow in the source window identifies the line to which execution returns after the routine call. Depending on the source language and coding style, this might be the line that contains the call statement or the next line.
Figure 7-2 Screen Mode Source Display When Source Code Is Not Available

If your program was optimized during compilation, the source code displayed in SRC might not always represent the code that is actually executing. The predefined instruction display INST is useful in such cases, because it shows the exact instructions that are executing (see Section 7.4.4).
The built-in command that automatically updates display SRC is EXAMINE/SOURCE .%SOURCE_SCOPE\%PC. For information about the EXAMINE/SOURCE command, see Section 6.4. The built-in debugger symbol %SOURCE_SCOPE denotes a scope and has the following properties:
You can use display SRC to display source code throughout your program, if source code is available for display:
After manipulating the contents of display SRC, you can redisplay the
location at which execution is currently paused (the default behavior
of SRC) by pressing KP5.
7.4.1.2 Displaying Source Code for a Routine on the Call Stack
The command SET SCOPE/CURRENT lets you display the source code for any routine that is currently on the call stack. For example, the following command updates display SRC so that it shows the source code for the caller of the routine in which execution is currently paused:
DBG> SET SCOPE/CURRENT 1 |
To reset the default scope for displaying source code, enter the
command CANCEL SCOPE. The command causes display SRC to show the source
code for the routine at the top of the call stack where execution is
paused.
7.4.2 Predefined Output Display (OUT)
Figure 7-1 and Figure 7-2 show some typical debugger output in the predefined display OUT.
Display OUT is a general-purpose output display. By default, OUT has the output attribute so it displays any debugger output that is not directed to the source display SRC or the instruction display INST. For example, if display INST is not displayed or does not have the instruction attribute, any output that would otherwise update display INST is shown in display OUT.
By default, OUT does not display debugger diagnostic messages (these appear in the PROMPT display). You can assign display attributes to OUT so that it captures debugger input and diagnostics as well as normal output (see Section 7.3).
By default, the memory buffer associated with predefined display OUT
contains 100 lines.
7.4.3 Predefined Prompt Display (PROMPT)
The predefined display PROMPT is the display in which the debugger prompts for input. Figure 7-1 and Figure 7-2 show PROMPT in its default location, the bottom sixth of the screen.
By default, PROMPT has the prompt attribute. In addition, PROMPT also has (by default) the program and error attributes, which force program output and diagnostic messages to that display.
PROMPT has different properties and restrictions than other displays. This is to eliminate possible confusion when manipulating that display:
The debugger alerts you if you try to move or expand a display such
that it is hidden by PROMPT.
7.4.4 Predefined Instruction Display (INST)
By default, the predefined instruction display INST is not shown on the screen and does not have the instruction attribute (see Section 7.4.4.1 and Section 7.4.4.2). |
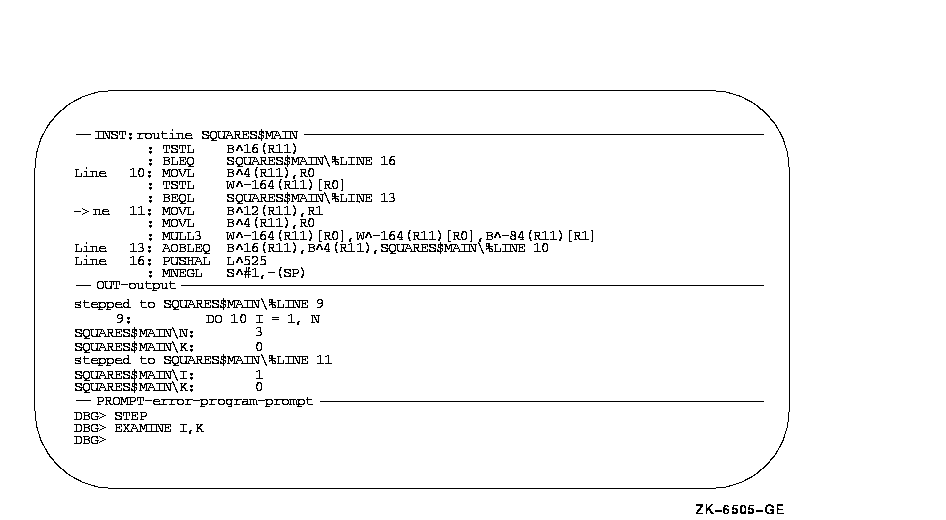
Display INST is an automatically updated instruction display. It shows the decoded instruction stream of your program. This is the exact code that is executing, including the effects of any compiler optimization.
A VAX example is shown in Figure 7-3.
This type of display is useful when debugging code that has been optimized. In such cases some of the code being executed might not match the source code that is shown in a source display. See Section 14.1 for information about the effects of optimization.
You can use INST in two basic ways:
The name of the routine whose instructions are displayed is shown at the right of the display name, INST. The numbers displayed at the left of the instructions are the compiler-generated source line numbers.
As you execute the program under debugger control, INST is updated automatically whenever execution is paused. The arrow in the leftmost column points to the instruction at which execution is paused. This is the instruction that will be executed next and whose address is the current PC value.
Figure 7-3 Screen Mode Instruction Display (VAX Example)

The built-in command that automatically updates display INST is EXAMINE/INSTRUCTION .%INST_SCOPE\%PC. For information about the EXAMINE/INSTRUCTION command, see Section 4.3.1. The built-in debugger symbol %INST_SCOPE denotes a scope and has the following properties:
By default, display INST is marked as removed (see Section 7.5.2) from the display pasteboard and is not visible. To show display INST, use one of the following methods:
You can use display INST to display decoded instructions throughout your program as follows:
After manipulating the contents of display INST, you can redisplay the location at which execution is currently paused (the default behavior of INST) by pressing KP5.
| Previous | Next | Contents | Index |